
Comparing pressure loss at the same flow and service conditions gives buyers a useful basis for evaluating valve options. With suitable configuration-specific data, a transparent liquid-duty calculation can show the hydraulic difference and the assumptions behind an energy estimate.
For a liquid-duty screening comparison, hydraulic power associated with a loss is flow multiplied by pressure drop. Electrical input also depends on the pump/motor system and operating point. Use explicit assumptions and do not treat a screening result as a guaranteed saving.
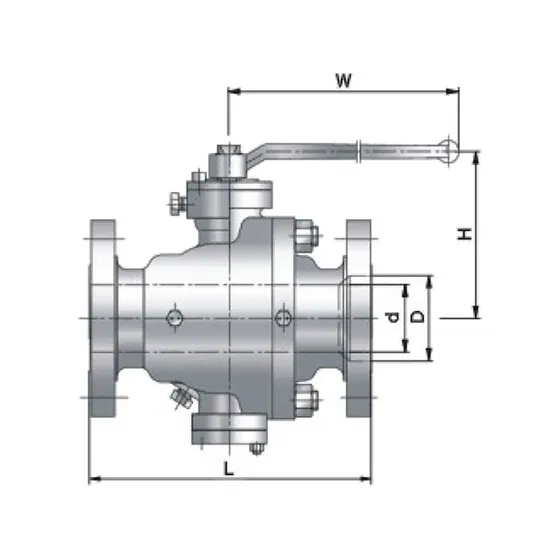
ZGV's floating and trunnion ball-valve catalogue gives buyers real configurations to shortlist for a hydraulic comparison. Pair the selected size and build with configuration-specific flow data, then evaluate pressure loss and pumping energy at the project's actual operating points.
Compare equivalent duties first
Obtain configuration-specific flow data for both offers. Size, bore, trim and operating position belong with that data. Confirm the fluid properties and the method used to determine loss; a generic Cv table for another valve is not numerical evidence for the proposed ZGV assembly.
The full-bore versus reduced-bore guide explains why an area ratio is not a Cv or pressure-loss ratio. This article takes the next step once suitable pressure-loss data is available.
Also separate isolation from regulation. A control valve may deliberately absorb pressure to regulate a process. Removing that drop without reviewing the control task is not an efficiency improvement established by arithmetic alone.
A fully stated hypothetical comparison
Assume two acceptable isolation-valve proposals are compared at the same clean-liquid flow. All performance values below are hypothetical; they are not ZGV measurements or supplier quotations.
| Input | Assumed value |
|---|---|
| Flow through either option | 36 m³/h = 0.010 m³/s |
| Option A pressure loss | 0.9 bar |
| Option B pressure loss | 0.3 bar |
| Difference in loss | 0.6 bar = 60,000 Pa |
| Combined electrical-to-hydraulic efficiency for this screen | 0.65 |
| Annual operation at this duty | 6,000 hours |
The hydraulic-power difference is:
0.010 m³/s × 60,000 Pa = 600 W
Using the assumed combined efficiency, the electrical-input difference is:
600 W ÷ 0.65 = 923 W, or approximately 0.923 kW
At the assumed hours:
0.923 kW × 6,000 h ≈ 5,538 kWh per year
This is a conditional screening estimate. It assumes the same delivered flow, the stated loss difference and the stated efficiency. Actual pump controls and the system curve can change the operating point. A final evaluation needs the pump/system response, rather than assume that every reduction in valve loss produces the same electrical reduction.
When lower valve loss becomes lower electrical input
For a system that maintains the same required flow, a suitable control strategy may allow the pump to supply less head after a loss reduction. The resulting electrical change still depends on the revised operating point and efficiency.
For a fixed-speed installation, lower resistance can instead move the pump/system operating point and change flow. If another regulating valve absorbs the released head, the local loss reduction may simply move elsewhere in the system. In either case, subtracting valve losses alone does not establish a bill saving.
The U.S. Department of Energy pump-system resources cover control strategies, assessment and control-valve energy opportunities. Use a system assessment to determine which situation applies before converting the worked screen into a project claim.
Show sensitivity instead of false precision
Operating hours and efficiency can materially change the result. Keeping the same assumed 600 W hydraulic difference gives:
| Assumed combined efficiency | 3,000 h/year | 6,000 h/year |
|---|---|---|
| 0.50 | 3,600 kWh | 7,200 kWh |
| 0.65 | 2,769 kWh | 5,538 kWh |
| 0.80 | 2,250 kWh | 4,500 kWh |
The rounded values show the sensitivity of the arithmetic. They do not describe a ZGV product's efficiency or operating history. If annual flow varies, calculate each relevant duty segment rather than use one maximum-flow point for the whole year.
A financial comparison would additionally need the buyer's actual tariff and comparable installed costs. No valve price, payback period or carbon saving is established by this example.
Use the right hydraulic basis
Spirax Sarco's water control-valve sizing tutorial explains the connection between flow, differential pressure and valve coefficient, as well as installed-system behaviour. Its treatment supports the method distinction; it does not provide a ZGV flow coefficient.
Check units carefully. Flow in m³/h must be converted to m³/s in the watt calculation above. Pressure in bar must be converted to pascals. If the efficiency already combines pump and motor effects, do not divide by the same loss twice under another label.
The simple comparison also does not size gas, steam, flashing or two-phase service. Those duties require the appropriate flow model and physical properties before any energy assessment is meaningful.
Read a supplier's savings statement critically
| Statement | Missing basis to request |
|---|---|
| “Larger bore saves 30% energy” | Configuration-specific loss, actual operating points and system calculation |
| “Cv is higher” | Actual size, trim, position, test basis and fluid applicability |
| “Pump runs 6,000 hours” | Hours at each flow/pressure condition, not only motor energised time |
| “Lower pressure loss” | Same flow and comparable fluid/installation conditions |
| “Fast payback” | Actual price difference, installed scope, tariff and maintenance assumptions |
A smaller pressure drop can be valuable, but the evidence should make the comparison reproducible. Even when the precise economic benefit is unknown, identifying the major assumptions helps the buyer decide what data to collect next.
Prepare a configuration-specific ZGV hydraulic enquiry
ZGV's 2511 floating and 2514 trunnion ball-valve pages publish real geometry and material references. The bore or listed catalogue weight should not be substituted for a flow-loss curve.
For a comparison, send the flow range, fluid properties, operating position and allowable loss. Request relevant configuration-specific data and make any unavailable performance field explicit. The project team can then assess energy at the system's actual duty.
Label the calculation inputs as measured, supplier-predicted or assumed, and retain their dates and configurations. That makes a later update straightforward: replace the assumption with verified data and rerun the same transparent calculation without rewriting the history as a measured saving.
Submit the hydraulic comparison inputs with the required configuration. A transparent calculation with a few verified inputs is more useful than a large saving percentage with no reproducible basis.
ZGV VALVE · Zhejiang Zhonggong Valve Group Co., Ltd. · Quality and certification records
Download the ZGV valve RFQ template and share your service conditions, quantities and required documents with ZGV.